Strategic transport models are validated against real-world traffic counts — but counting is expensive, and you can only measure a fraction of the network. I led the development of a methodology that answers the where and how many with network science, applied to all four of Israel's metropolitan models.
Developed at the Ministry of Transport's System-wide Planning Department ("Eshed" directorate) together with Marcus Szeniuk and Ido Klein, in collaboration with Prof. Shlomo Bekhor of the Technion. Presented as a poster paper at the ISTRC 2026 conference.
“The manuals say 'count 5–20% of your links.' Which links? They don't say. We built an algorithm that does — transparently, reproducibly, for any network.”
Every strategic transport model — the models behind billions in infrastructure decisions — must prove it reproduces real traffic. That proof comes from traffic counts at selected road links. But every counting station costs money, so agencies face the same question everywhere: where exactly should the counters go? International manuals offer only rough ranges. We turned that guesswork into an algorithm that combines statistical sampling theory with network science.
Filter the network: only links that carry private vehicle traffic are eligible, and ramps and very short links (under 200 m) are excluded as count locations. Everything stays in the graph, though — so the centrality math stays honest.
Compute betweenness centrality for the entire network: the shortest routes between all origins and destinations are found with Dijkstra's algorithm, and every link is scored by how many of those routes pass through it. High centrality means the link is a load-bearing beam of the network.
Tune it for the metropolis: the routes are weighted by distance — otherwise everything funnels onto the national highways, which Israel already monitors with permanent counters. Distance weighting lets the urban connectors surface, so sampling can focus on the metropolitan road classes (4–5).
Sample zone by zone: within every traffic analysis zone, the top 20% (configurable) of metropolitan links by centrality are selected — a share in line with what the scientific literature recommends.
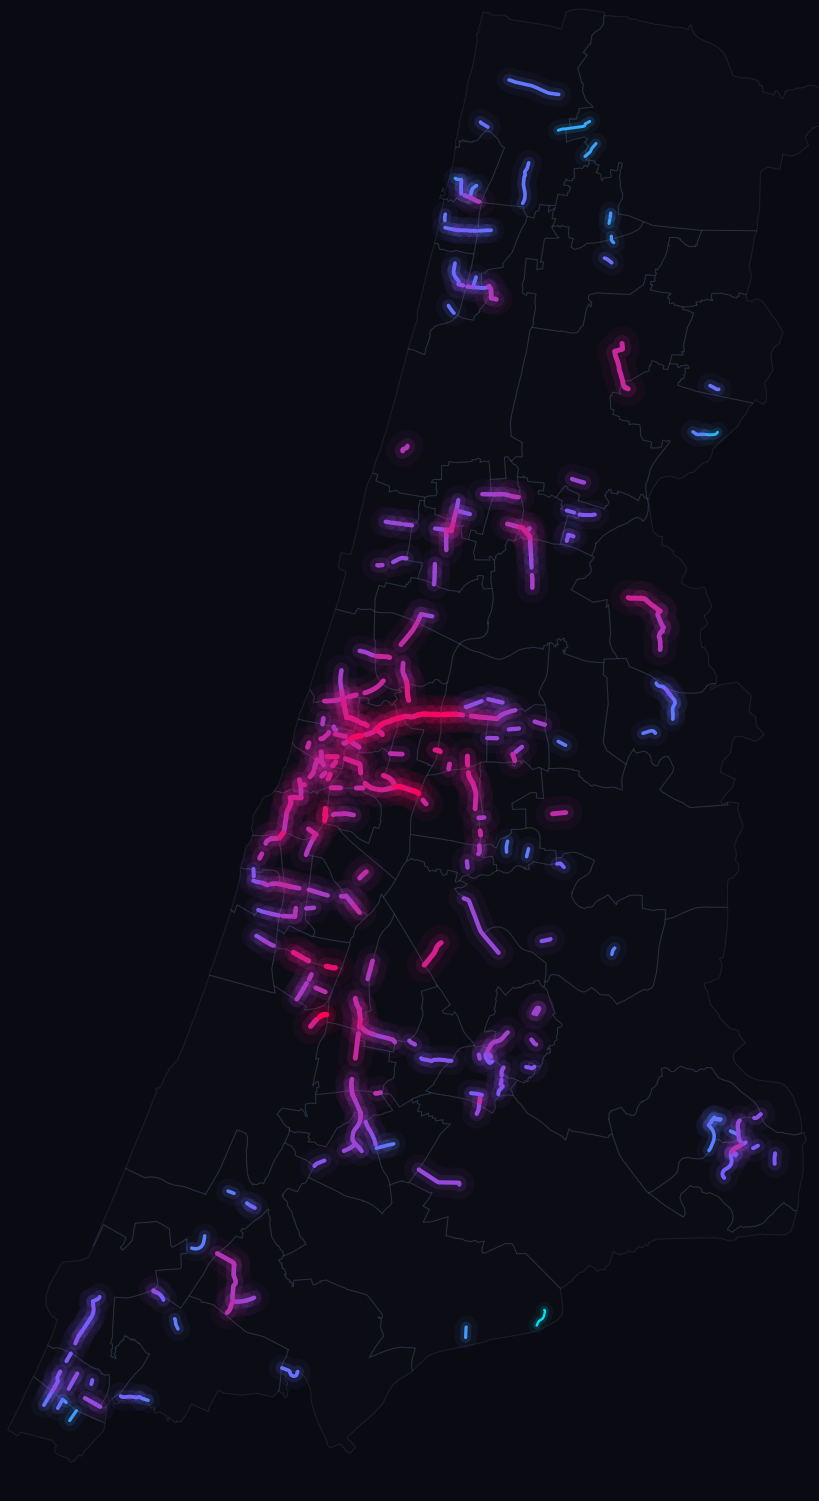
The result is a spatially balanced 'measurement skeleton': every zone in the metropolis is covered, and within each zone the budget goes to the most connected, most important roads.
The methodology was applied to Israel's four metropolitan strategic models. Across the four, 755 count locations were selected out of 3,448 eligible metropolitan links — about 22%, roughly the top fifth of every traffic zone. Each map shows the selected links glowing over the model's traffic analysis zones, colored by betweenness centrality score.
Hover over a glowing link to see which road it is and how central it sits in the network.
1,526 eligible metropolitan links · 335 selected (22%)
Hover or tap a link for details · switch metropolitan area with the buttons
Imagine computing the shortest route between every pair of zones in a metropolitan area — hundreds of thousands of routes, each found with Dijkstra's algorithm. Some road links appear in a huge share of those routes: bridges, interchanges, key connectors. That share is the link's betweenness centrality — shown on the maps as a simple 0–100% score. For the metropolitan sample the routes are weighted by distance rather than speed: speed-weighting funnels every route onto the national highways, which Israel already monitors with permanent counters, while distance-weighting reveals the urban roads that hold the metropolis together.
Hover any link to see its share
Watch it live: every moment, the shortest route between two random zones lights up. One link keeps getting crossed — the bridge between the two halves of the network. That's high betweenness centrality.
Selection is then zone-based: within each traffic analysis zone, the top 20% (configurable) of metropolitan links (classes 4–5) by centrality are picked — a sampling share consistent with the scientific literature. This guarantees true spatial coverage: no zone is left unmeasured, and within every zone the counting budget goes to the most connected, most important roads.
for each zone: select top 20% of class 4–5 links, ranked by Cᵦ(e)Here, Cᵦ(e) is the betweenness centrality of link e — the share of shortest routes between zone pairs that cross it, as described above. In the deployed version this calculation is distance-bounded: each road class has its own maximum distance (configurable) beyond which a shortest route no longer counts toward a link's centrality, computed via Dijkstra's algorithm with edge weights based on that class's typical travel speed (also configurable).
The methodology was presented as a poster paper at the Israel Section of Transportation Research Conference 2026. The poster describes the general sampling framework; the version deployed for the four metropolitan areas extends it with distance-based centrality and per-zone selection, tuned for metropolitan roads.
Golan Ben Dor, Marcus Szeniuk, Ido Klein — Ministry of Transport · Shlomo Bekhor — Technion
View Full-Size Poster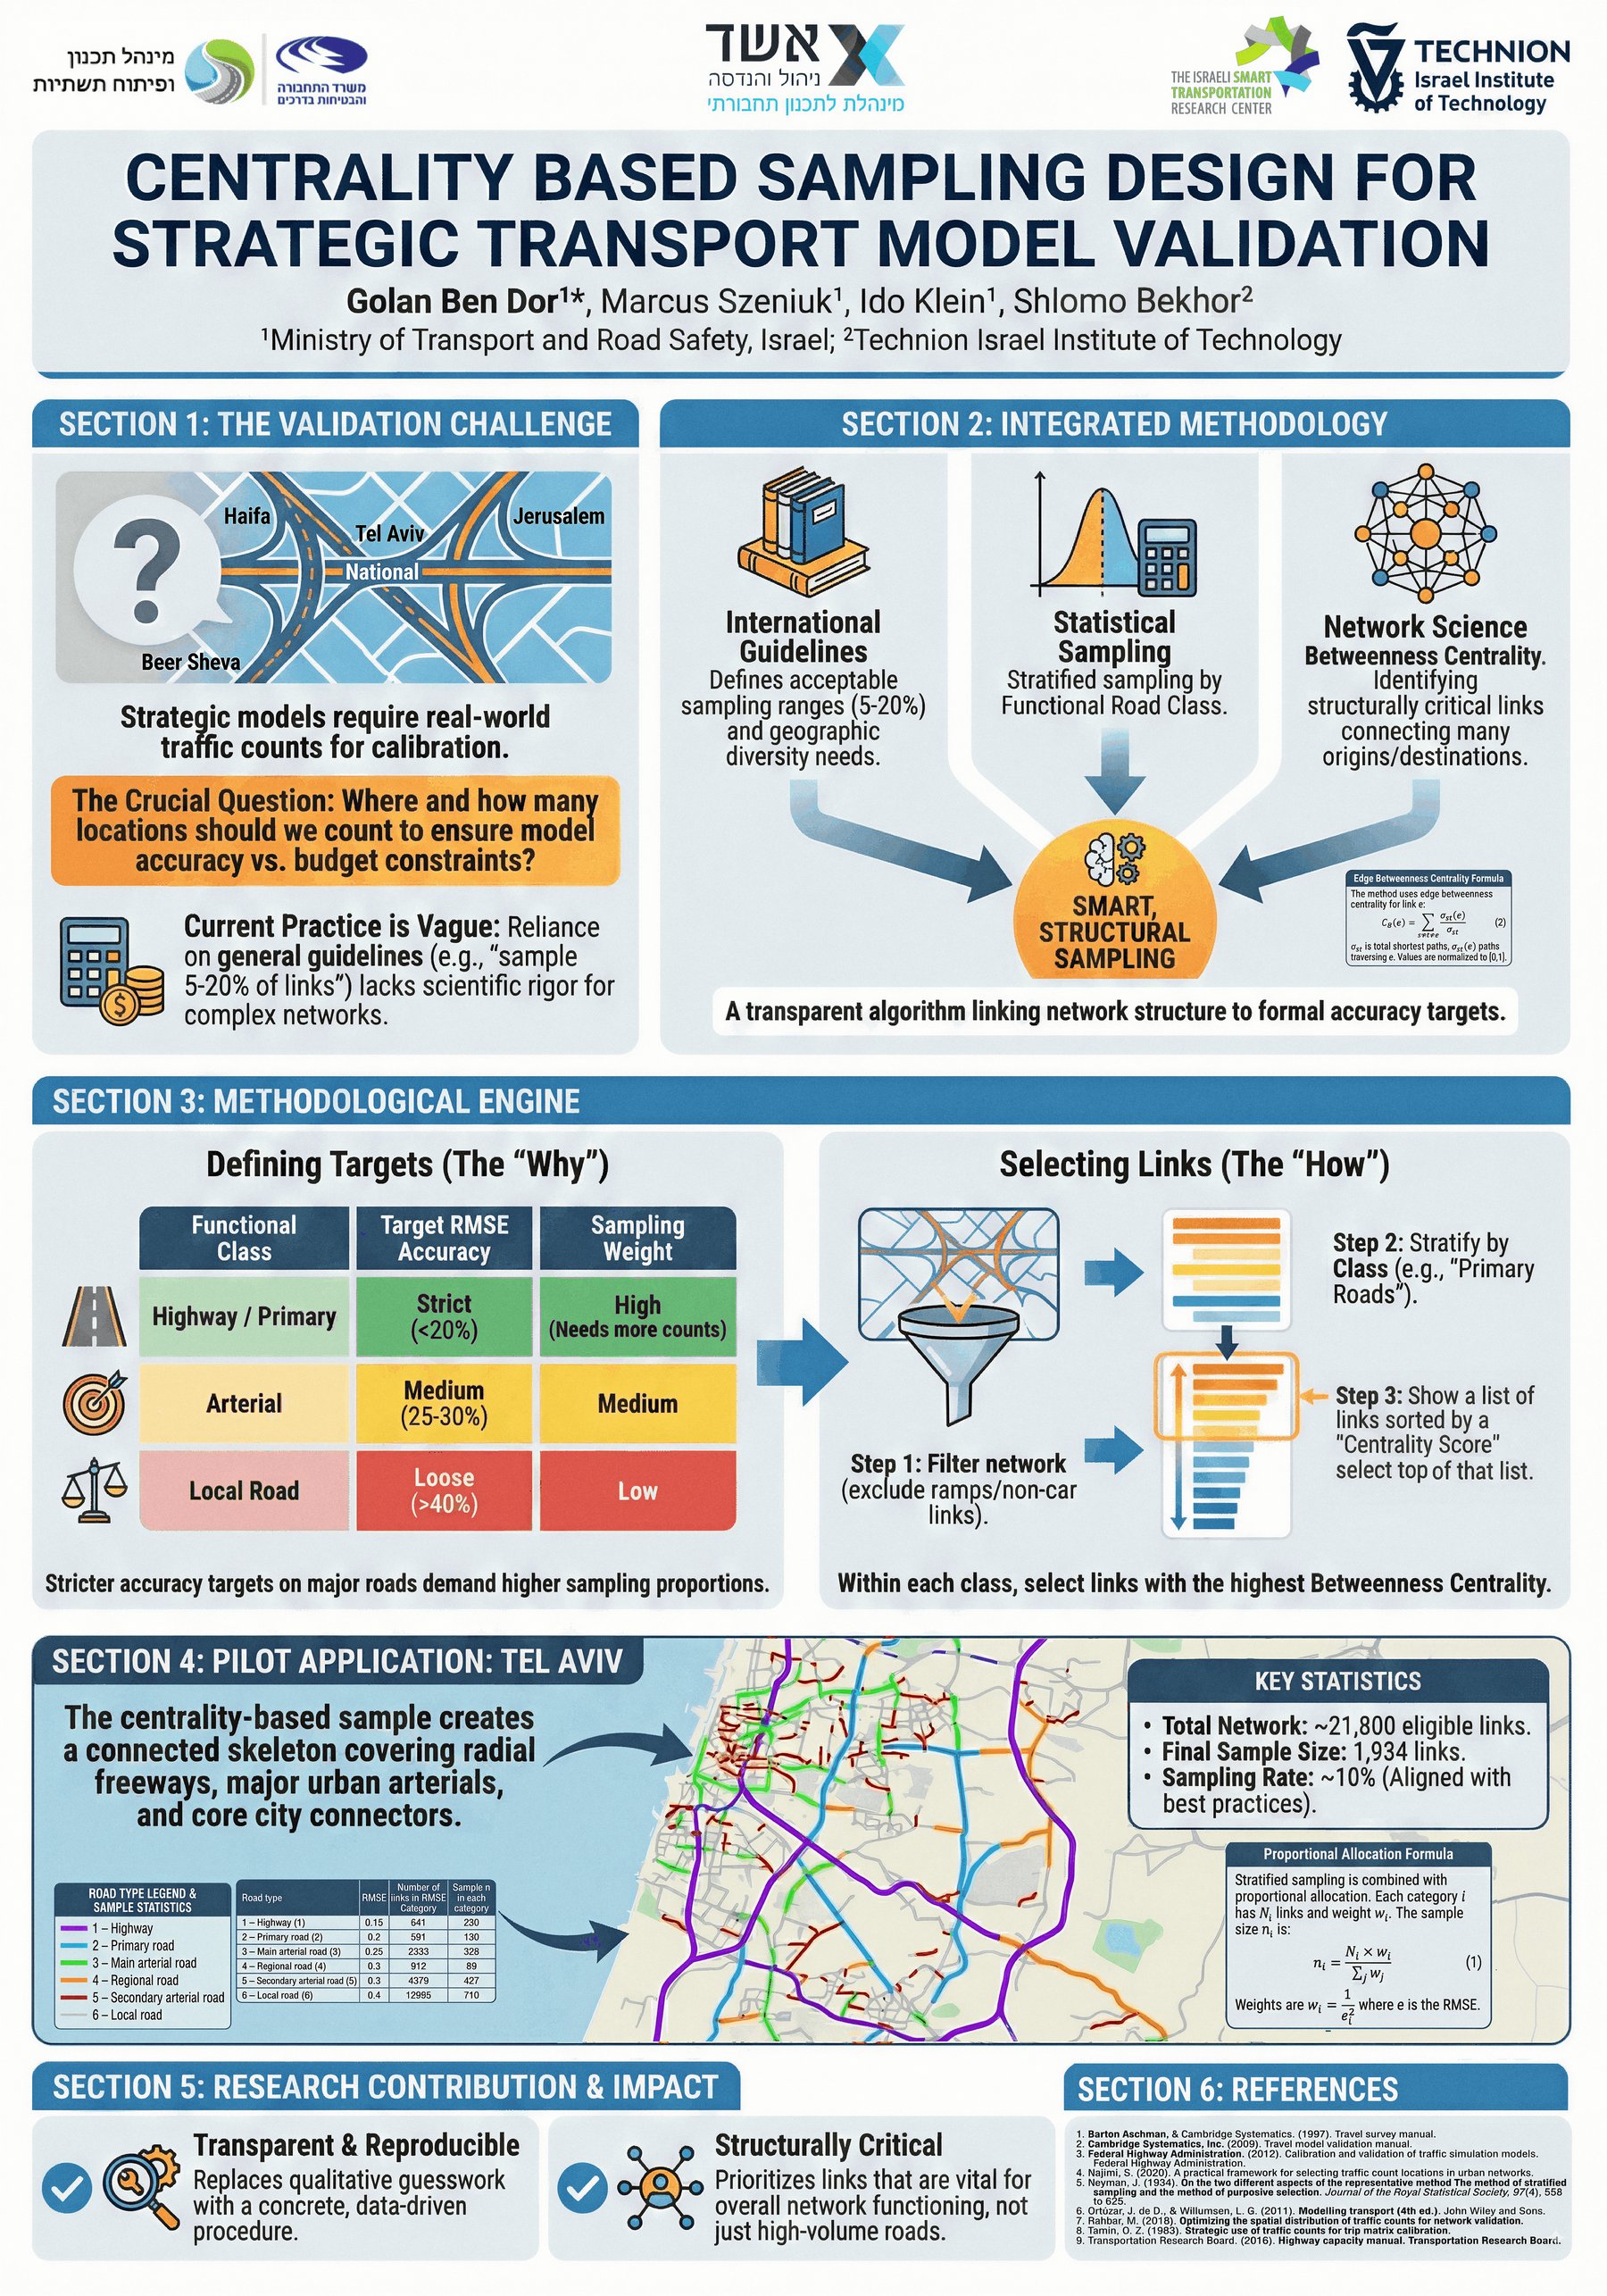
Every counting station means field equipment, crews and processing budgets. This methodology makes sure each one buys maximum validation power: the sample is structurally critical, covers every traffic zone, and focuses on the metropolitan roads that have no permanent monitoring — the national highways are already counted. It replaces 'we count where we've always counted' with a transparent, defensible, repeatable procedure — applied to the strategic models of all four of Israel's metropolitan areas.
Want methodology like this behind your transport decisions?