How I orchestrated the survey methodology and coordinated the placement of hundreds of count stations across Israel's transport authorities — Netivei Israel, Netivei Ayalon and the Jerusalem Transportation Master Plan Team — creating the first traffic count survey with full national coverage.
Led within the Ministry of Transport's 'Models Round Table' — the forum governing Israel's five strategic transport models. Every count line and station was agreed jointly with Netivei Israel, Netivei Ayalon and JTMT, inside one unified GIS framework.
“Five models, three authorities, one map. The entire survey lives in a single shared GeoPackage that every partner reviews, refines and executes from.”
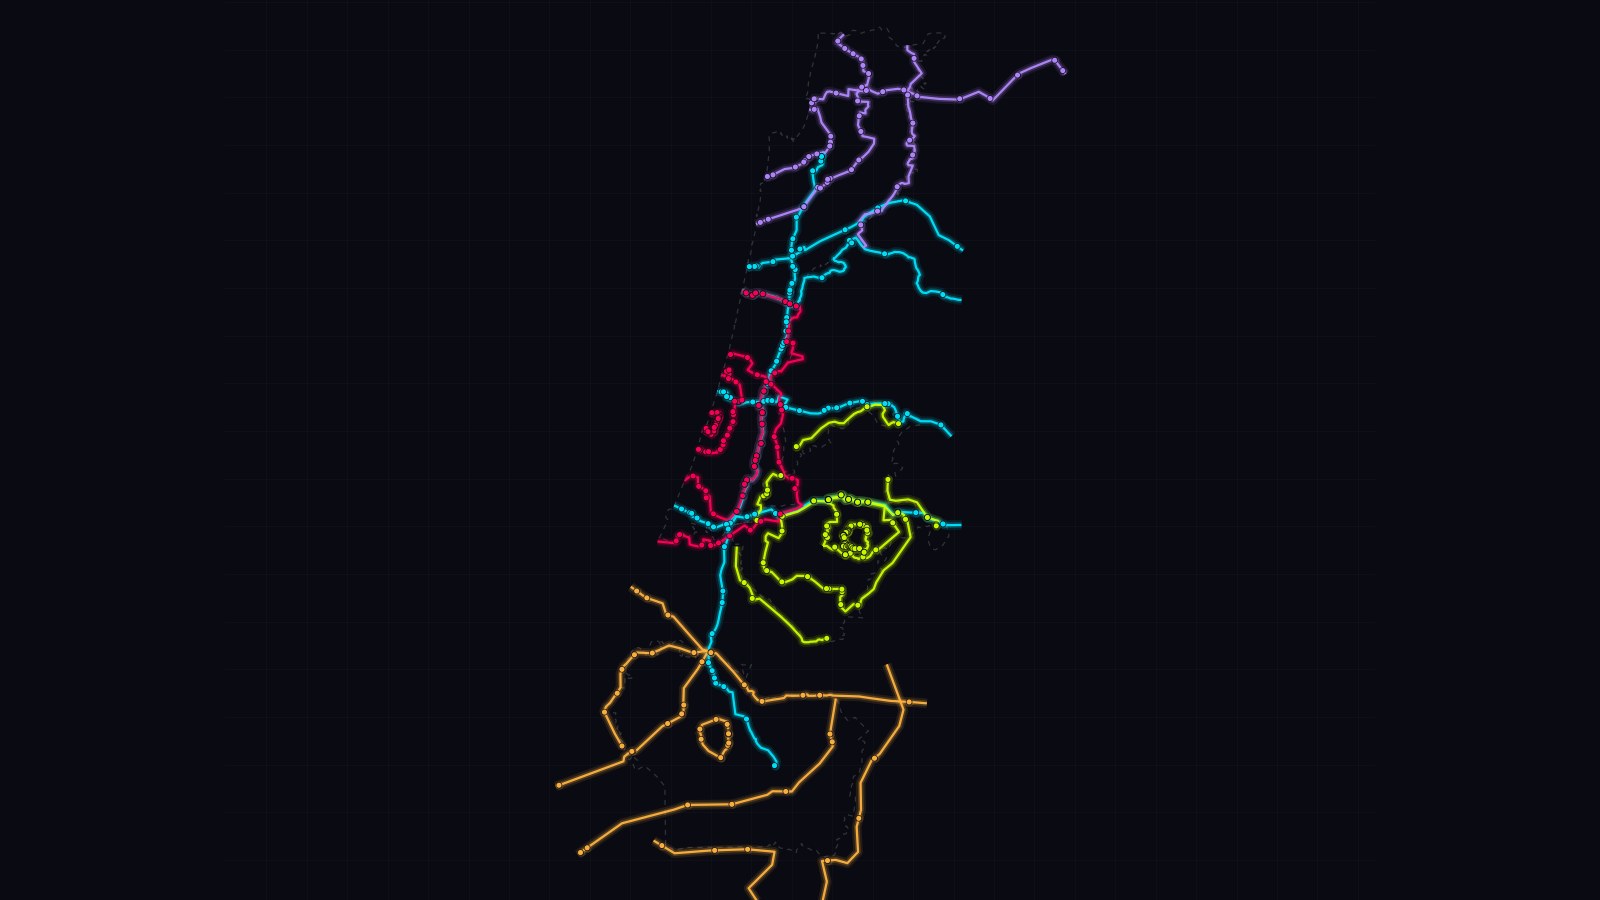
Cordon and screenline counts are the gold standard for validating transport models: strategic measurement lines are drawn across the road network, and every road crossing them gets counted. Previous Israeli surveys covered single metropolitan areas. The 2026 survey is the first with full national coverage — all five strategic models, one methodology, one shared map. My role: orchestrate the methodology and coordinate, with all partners, exactly where every count station goes.
28 cordon & screenline lines, 355 count stations, five model regions. Hover or tap a line for details, and use the legend to filter by region.
Select a corridor on the map
Survey totals
414 mapped count points incl. alternates
Hover or tap a line · click a region to filter
28 cordon and screenline lines were defined relative to the boundaries of the metropolitan and national models — closed rings ('cordons') around cities and metropolitan areas, and crossing lines ('screenlines') along natural or artificial barriers.
Every road crossing a line becomes a count station. Each candidate crossing was examined individually — questionable ones (minor local or agricultural roads) were explicitly resolved with the responsible authority, converging on 355 final stations.
The full map — lines, stations and model boundaries — lives in a single shared GeoPackage. Each authority reviewed its region, moved or confirmed stations, and the agreed version became the binding execution plan.
Strict timing rules preserve data consistency: all lines of a region are counted within a single two-month window, and each individual line within one or two days — so entry/exit balances can actually be verified.
Each authority — Netivei Israel (national model), Netivei Ayalon (Tel Aviv, Haifa and Be'er Sheva models) and JTMT (Jerusalem) — executes the counts in its own territory, with its own contractors and budget. My work was making sure this decentralized execution produces one coherent national dataset: a standard station-placement methodology, a unified GIS data structure, shared vehicle classification, synchronized timing rules, and a clear escalation path to the Round Table for overlaps and disputes.
Strategic transport models drive multi-billion shekel infrastructure decisions — and they are only trustworthy if periodically validated against reality. This survey creates the reference dataset for validating all of Israel's strategic models in a single coordinated cycle, designed to repeat every two years.
Need methodology orchestration across multiple agencies?